Physics AS
Introduction Physical Quantities & Base units Vectors & Scalars Kinematics Pressure & Density Dynamics Momentum Energy, power & efficiency Deformation of solids Waves Superposition Stationary waves Electric fields Electricity Circuits & Kirchoff's laws Radioactive Physics AS PracticalPaper 5More
Reference Pastpaper Questions
Physics(9702) Practicals - Tips to get fullmarks
Basics
Truly for you to master the practicals you must look at some past papers. That's why I have given a list of past papers below!
However, there are somethings and points you need to remember
Follow the instructions
The instructions are quite straight forward and basically explains the whole process. You need to identify what is being changed and what is being measured. This is important as this gives us an idea of what is supposed to change
Significant figures
The marksheme for the practical paper has strict marks for significant figures
If you took a measurement and you're suppose to record it, we need to give it to the precision of instrument used or given
Here is a list of the decimal places you must leave the value in for each instrument
| Name | Decimal places |
|---|---|
| Ruler | 1 d.p in cm |
| Meter ruler | 1 d.p in cm |
| Micrometer | 2 d.p in mm or 3 d.p in cm |
| Vernier calliper | Depends - See below |
| Stopwatch | 2 d.p in seconds |
| Weighing scale | Depends - follow the scale |
So the above table tell us how many decimal places a reading must be left in for each instrument used
Also a point to remember. If they give 2 marks to obtain a particular value, it means they give marks for averaging also
For example, they might ask to find the diameter of the wire using the micrometer so we must take atleast 3 readings and find the average
The next part they ask is the percentage uncertainty and there are some misconceptions about this part. We will discuss it below!
For the experiment:
They will give a table and ask us to get 6 different values (make sure you do 6) for the independant variable
We might have to calculate some values for the dependant variable. The calculated value must be given in the lowest Significant figure of the recorded raw data used in the calculation
For example, if we need to find density and the mass is given to 2 S.f and the volume to 3 S.f, then the density is given to 2 S.f
They usually ask this question directly:
Explain how many significant figures should the density be given in
You must state that we must use the lower of the significant figures of the raw data used and also state the raw data used are the mass and volume.
And say the one with the lowest significant figure is for the mass which is 2 S.f. So we record the density in 2 S.f
Note how I stressed the word recorded data. This is because, this method only applies for recorded data. If we use a constant in a calculation, it won't affect the final reading S.f - Let's see an example
The Current(A) is 0.333A. What is 1/A?
The reciprocal of A must also given in the same S.f of 3
Another example is when we find the period, we usually find the time for 10 Oscillation(this is required) and we get(example) 13.23sec
To find the time for one oscillation we divide it by 10 and this become 1.323 sec, it must follow the same S.f - So please remember this!
Another point is that the S.f of a field or column must be consistent(which naturally happens, if you follow the above rules)
Taking readings
When taking values for an experiment, we must change the independant variable and make sure they cover a large range such as taking the maximum and the lowest reading.
The values for the independant variable must be evenly spaced
For example, if we allowed to take a max mass of 200g and a min mass of 50g. The difference is 150g. Then divide it by 5 so then we know the mass should increase by 30g for every trial.
50g, 80g , 110g, 140g, 170g, 200g
This uses the maximum range possible and it is also evenly spread.
If you can't get an even spread, try rounding it to the nearest value which can be read
Table
They will ask you to record 6 values which means 5 additional values because, you already recorded one at the start of the paper
Make sure the heading includes the name and also the units
The data in the table should not have the units
Make sure you follow the significant figure rule
Graph
They will ask you to plot the graph using the values from the table. Make sure you follow the instructions
Use small crosses to plot the points
Label the axis with the correct units and names
Make sure you use a good scale of multiples of 2 , 4 , 5 or 10 - Never use 3 or 9!
Make sure the scale is marked and don't leave anything blank - (Example if we start from 20 and it goes until 30, then mark 22 24 and 26 and 28)
Usually we must be able to determine the line of best fit. This is done by drawing the line which passes close to all the point (this can be cleverly manipulated!)
The markshemes only accept one anomolous point which must be circled and labelled. So make sures other points are very close to the line
How close should the points be depends on the marksheme
Gradient
Finding the gradient is easy
Y2-Y1/X2-X1
The process of finding the gradient must be shown. So we need to show dotted lines and draw a dotted triangle
Take two points in the graph and make sure it occupies more than half of the graph!
Find the gradient using the above equation
Units are not required for gradient
Then after find the gradient, they will ask you to find the y Intercept (c)
Use this equation
y = mx + c
C is the Y Intercept. To find this we need to substitute a x value and a y value (which is part of the line of the graph) and the gradient (m) which you found and find C
C has the same units as the Y variable
Base units and Constants
Most of the time, some questions gives us the equation in a different form which can be linked with the original y = mx+c
By using this equation, we can find the constants in the new equations
y = 2ax + z
Is same as:
y = mx + c
To find a and z:
By comparing with the original equation, we can see that z is the same as c and that 2a is equal to the gradient (m)
By equating these, we can find the values but, questions are trickier than this
The units for a and z can be found by the same way and must follow the original equations
Proving Relationships
Sometimes they ask to do an experiment and find whether the relationship is true or not
For example:
T ∝ √L
They will ask to calculate the constant K for two or three different independant variable values
This is done by
T/√L = K
We must follow the significant rule and record K in the lowest significant figures. Also they might ask to explain this!
Now usually due to many other factors such as random errors and human error, the values of K would not be exactly the same. Sometimes it could be very different but, what must be the criteria used to check if the constants calculated are actually the same(within experimental accuracy) or not?
Take The difference between the two values of K and divide it by the lowest K value
For this particular calculation, K can have more significant figures, if you want to make it more accurate
(Kmax-Kmin)/Kmin
You must clearly state this criteria:
- The Percentage difference between the two K values are greater than 10 % and so this shows that the constants are not within experimental accuracy. Thus, it shows that the relationship or hypothesis is not true
If it is within 10%, then you should say:
As the percentage difference is less than or equal to 10%, it is within experimental accuracy and so the relationship is be true
Improvements
In my opinion, this is the hardest part of the paper as they ask to identify the errors and the improvements for each error
This usually depends on the experiment but, I will discuss some errors which are common in markshemes
1. Two values of K are not enough to make a conclusion - so you must take more values and reading and plot a graph to see if it is a straigth line
2. If the experiment is measuring time ( like the period ), you can say it is difficult to determine the end and the start of oscilliation - so you can either use a fiducial mark or use a larger length of wire or use a video camera and a timer in the background to find the period more precisely
3. This is for oscillations, you could say the oscillations dies off easily - we can use a lead bob or switch off the fans and close the windows
4. If the Experiment included measuring a height or measuring length, then you can say that the length was not measured accurately - The improvement is to measure the length between the centre of masses and this may need a micrometer. Or if they ask to measure the height, we can be consistent with the results (such as reading it from the same point)
5. If the experiment includes dropping something, the object may had sideway velocities from the hand. so we can use an electromagnet as an improved version
There are actually many things you can comment on but, just remember these points. Difficulty in reading, lack of results, external factors, using non precise instruments (use sensors instead)
Micrometer and Vernier calliper
We will discuss on how to use them. Also this might come in MCQs and Theory!
- Micrometer
- Vernier Calliper
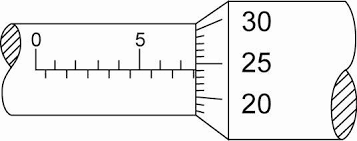
Make sure that the object is between the jaws of the micrometer. First read the main scale which is in millimeters
The main scale is read to the nearest 0.5mm
Then take the fractional scale which is from 0 to 50. This scale must be multiplied by 0.01mm
The point where the fractional scale is aligned with the main scale, read it and multiply it by 0.01mm and add it to the main scale
Reading = Main scale Reading + (Fractional scale Reading * 0.01)
This gives the final value in millimeters!
In practice, the smallest value is given in the instrument
In MCQs, this must be calculated
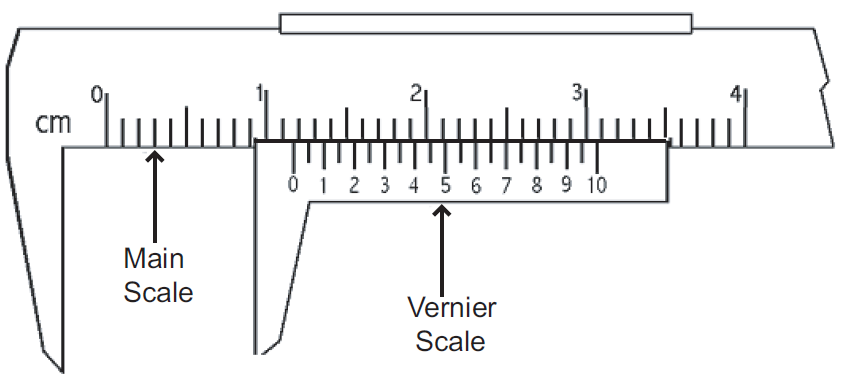
The main scale is usually given to nearest 0.1cm and sometimes the secondary scale can have either 10 or 50 divisions
If it is 10 divisions then the smallest reading is 0.01cm
0.01cm = 0.1/10
If there is 50 divisions, then the smallest reading is 0.002cm
0.002cm = 0.1/50
Notice that this is in centimeter and so the final value is given in Centimeters
Final reading = Main scale + (Sub-scale * smallest reading)
Zero error
Usually when the jaws of the micrometer or the vernier calliper are closed it must read 0
In reality, this is not the case and sometimes there could be positive or negative zero errors
So after finding the zero error you need to adjust the readings you get
Zero errors must contain the sign to indicate if it's positive or negative
I will talk about negative zero error only as it is a bit difficult
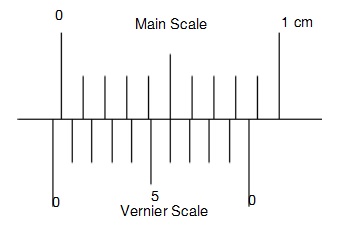
So we can see that the vernier scale is behind the zero mark. This shows it's a negative zero error
The vernier scale aligns at the 6th mark so this means 0.06cm. However, this value is not the answer. If it is a negative zero error we must take the remaining divisions which is 4 (10 -6) so we get 0.04cm. So the zero error is - 0.04cm
The reason for this is that the 0.06cm is more from the -0.1cm mark(imaginary) this gives us -0.04cm which is the zero error!
The reason why we include the sign is that whenever it is a positive zero error, we reduct it from the measured reading to get the final value
If the zero error is negative, we add to get the final reading
Final reading = Measured reading - ( Zero error )
Absolute uncertainty
Honestly, these topics are hard to explain digitally but, I will go through them briefly
In all instruments such as the ruler there is a minimum value which it can read. For example, a ruler reads to the nearest 1mm or 0.1cm
Half of this is 0.05cm
This is considered to be the absolute uncertainty for a single specific reading
However, we take the reading twice because, we find the change of length from the 0cm so the absolute uncertanity is the same as the minimum value of 0.1cm
This applies for all instruments, like for burettes - the minimum value is 0.05cm and so the absolute uncertainty is 0.1cm because. we take two readings when finding the volume
However, if we take the value of the temperature , it will have a minimum value of 1°C and the absolute uncertainty will be 0.5°C not 1°C as the value is taken only once
Remember that absolute uncertainty is not the same as the minimum reading. Sometimes it could be different or the same depending on the instrument
Relative Uncertainty and Percentage Uncertainty
This is simply the ratio between the absolute uncertainty and the reading
Relative uncertainty = Absolute uncertainty/Actual reading
Let's take an example. We measure using a 10cm ruler. what is the relative and percentage uncertainty?
0.1cm/10cm = 0.01
This is the relative uncertainty. To find the percentage uncertainty or the percentage error, just multiply the relative uncertainty by 100
1% = 0.01 * 100
Percentage uncertainty is very important especially when we need to find the percentage uncertainty for the final value
Also it's better to use percentage uncertainty as it makes calculations more easier
Absolute uncertainty when adding and substracting
Usually when doing calculations and the two values contain absolute uncertainties, to get the final absolute uncertainty we just need to add both of the absolute uncertainties
Absolute & percentage uncertainty when multiply by a constant
When a reading containing the absolute uncertainty is mutiplied or divided by a constant, the absolute uncertainty is multiplied or divided by the same amount
For an example, if a reading of 10cm with an absolute uncertainty of 2cm is divided by 10 then the final value is 1cm with an absolute uncertainty of 0.2cm
Also keep in mind that percentage uncertainty doesn't change when you muiltiply it by a constant like π
Percentage Uncertainty when Multiply/Dividing two or more readings
If a reading which contains an uncertainty is multiplied or divided with another value which has an uncertainty, you just add the percentage uncertainties together
This is why I said to use percentage uncertainty as in calculations it's much easier
Absolute Uncertainty in Averaging
This is very important and it goes to the point above where I mention that they ask to find the percentage uncertainty of a reading for a micrometer or vernier calliper
Many people think that you need to guess it but, there is a clear and easy method
As you did take atleast 3 readings, find the maximium reading and the minimum reading from the set of values
Then divide by two
Max reading - Min reading / 2
This final value will give the absolute uncertainty, then find the percentage uncertainty by dividing the absolute uncertainty with the averaged value (averaged recorded reading) and multiply it by 100
This is way easier
Accuracy
This shows how close a reading is to the actual value
For example, many MCQs will give a range of values and ask whether it is precise and accurate
The values are accurate if they are close to the actual value - For example we know g is 9.81 but, the values state 9.82, 9.80, 9.80 and so on, this is accurate as it is close to 9.81
The accuracy really depends if the experiment has systematic errors which are errors in the plan or set up of the experiment which affect each reading by the same amount and this can't be removed by averaging. This includes zero errors or scale errors so each reading is wrong by the same value
Precision
This is the difference between the highest value and the lowest value in the set of values/readings
In other words, if the difference is less, it means the readings are close together and more precise
This really depends on the random errors of the experiment which are errors which readings are affected by a random factor and can be reduced by averaging. These include changes in the enviroment, reaction time and parralax error
Let us take the same set of readings - 9.82, 9.80, 9.80
By judging we can clearly say these results are close together and so they are precise
And a further point is that these values are also accurate as the average is 9.81
In fact, accuracy and precision has no exact terms but, is a measurement of the degree of accuracy and precision
Here are some practice questions for you to try out. These are some of the physics practical papers. It's always good to try out some more past papers! They all have the same pattern, so if you master the above steps you can easily get full marks for your exams
We have come to the end of the Physics AS level syllabus of Physics 9702. The A level Section will be coming soon so until then, try out some past papers and watch the recommended videos!
Recommended
These are things you might like. Clicking these ads can help us improve our free services in the future...